
Back in May NAFSA released a short report titled Losing Talent: An Economic and Foreign Policy Risk America Can’t Ignore. It focuses on the decline in international student enrollment in US institutions in both 2016-17 and 2017-18 – the first ever double year decline experienced by the US – and provides an overview of the reasons why that has occurred.
I won’t spend time here summarising the NAFSA report. It’s quite short and easy to read.
The key theme of the NAFSA report is that international education is a global market and the US is losing market share to other countries that, for a range of reasons, are more attractive to international students. To make that point the report includes a chart showing the changes in global market share for key destination countries between 2001 and 2018.
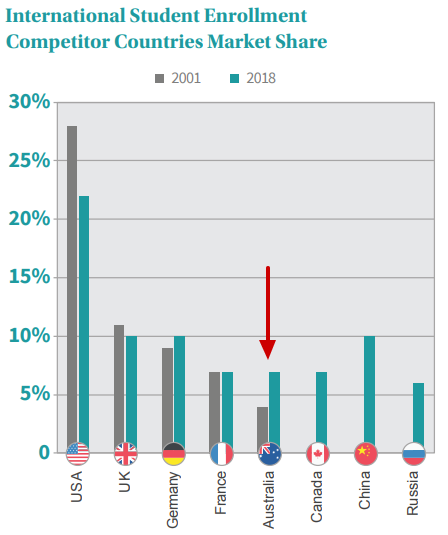
Let’s look more closely at the English speaking destination countries which are the most similar to the US in terms of what they offer international students:
- UK – lost market share.
- Australia – increased market share significantly over the period.
- Canada – it’s unclear why data for 2001 is not represented. Were there no international students in Canada in 2001? International student enrollments in Canadian institutions have increased significantly is recent years and it’s now not too far behind Australia.
The role of education agents
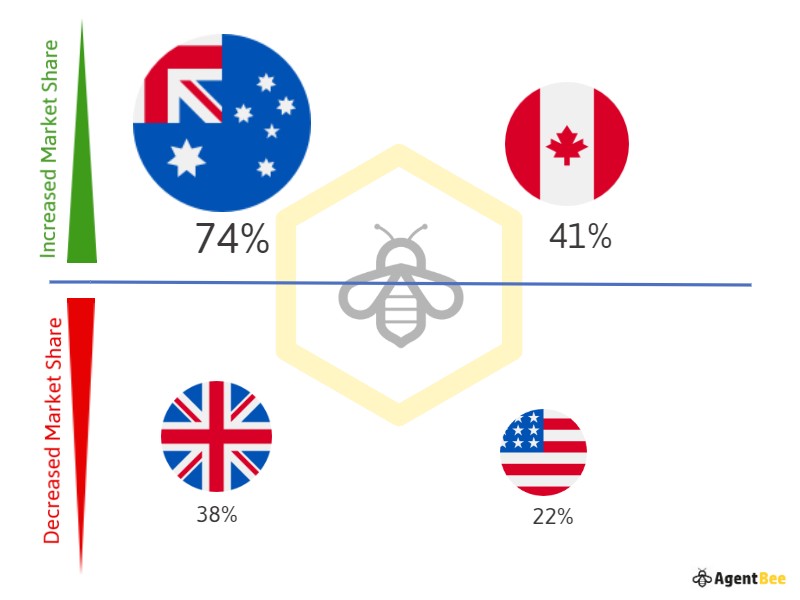
We decided to take the NAFSA data on changes in market share from 2001 to 2018 and overlay it with comparative data on the importance of education agents as an international student enrollment channel in each country.
The results are interesting.
Percentage of International Students Recruited by Education Agents
What to make of it?
The bubble chart shows that the countries that use education agents the most (Australia and Canada) have increased market share between 2001 and 2018, while the two countries that use education agents the least (USA and UK) have lost market share.
Does that mean that the two factors – use of education agents and market share – are directly related? No of course not. As the NAFSA report indicates, it’s a complex and competitive global market and there are a host of market push and pull drivers in play.
In fact you could take the closeness of the Canadian and UK percentages (41% vs 38%) to mean that the education agent channel has no bearing at all on market share given that Canada was a winner and the UK a loser over the 17 years between 2001 and 2018.
On the other hand the big gap between the outliers – Australia (75%) and US (22%) – at least raises the question that there could be something in the relationship between the use of education agents and market share.
The NAFSA Report lists the top 12 reasons for declining international student enrollments in the US. It comprises a range of push and pull factors. One of them is that students are enrolling in educational institutions in other countries, presumably pulled there because their product offering, comparative pricing, safety environment etc is better. In other words the international competition is winning.
In the Fall of 2017 just 19% of surveyed US institutions cited this factor as a reason for declining enrollments. A year later, in 2017 54% thought it was a factor. That’s a big increase. By the fall of 2018 59% percent of surveyed institutions thought that it was an issue.
It’s reasonable to speculate that one reason why international students are choosing other countries over the US is because the pathway from their home country to studying in the destination country is made easier by education agents. When faced with a choice between working with an education agent who will take care of much of the process and work involved in studying in Australia or Canada, versus the prospect of having to do much of the research, administrative and logistical work themselves for a US institution that does not use education agents, perhaps the path of least resistance becomes a factor in the student’s decision?
Looking ahead – the education agent opportunity for US institutions.
The use of offshore education agents is still a relatively new concept for many US institutions. After all it was only in 2013 that NACAC decide to remove the prohibition on US educational institutions using commission based agents to recruit international students. Since then the use of education agents by US institutions has grown strongly.
Institutions that can develop and implement an effective education agent strategy can take big strides towards their international student recruitment goals. Success will depend on implementing strong systems and processed to build and manage an education network.
Critical too is effective risk management. Working with education agents brings unavoidable risk. If an agent behaves unprofessionally or dishonestly, very often the outcome is that students are hurt and the institution takes a hit to its reputation. Our Education Agent Alert Database tracks reported incidents of misconduct by education agents over the last 10 years.
Effective assessment of new education agents, and ongoing monitoring of agent professionalism over the life of an agency agreement are essential to effectively manage risk.
AgentBee offers educational institutions a solution that enables them to:
- Manage the agent ‘lifecycle’ from initial assessment and recruitment, on boarding, contract management, and contract expiry and renewal.
- Assess the professionalism of an agent before engaging them, and monitor the professionalism and performance of authorised education agents over the life of the agency agreement/contract.
- Manage day-to-day engagement with and provision of information to agents.
- Accept and manage student applications from education agents.
Interested? Click here for more information
Note on Data and Sources
The data in the bubble chart above should be taken with a grain of salt. It’s very difficult to obtain reliable, point-in-time data on the proportion of international students in each country recruited by education agents.
Bridge Education Group had a very good shot at doing so in its 2016 Market Research Report, Pace of Adoption of International Student Recruitment Agencies by U.S. Institutions (see p 15). It’s an excellent read if you have some spare time. It was a good place for us to start. We relied on it to an extent but also used more recent data where it was available.
These are the sources we used:
Australia
A July 2019 report by an Australian Government Agency, the Australian Skills Quality Authority, states that education agents facilitated almost 74 per cent of the total overseas student enrolments in 2017 (see page 51)
Canada
We used the data in the Bridge Education Group report mentioned above. There is some anecdotal evidence that the use of education agents by Canadian institutions – and consequently the proportion of international students enrolled by education agents – may have increased in recent years, but we could not find any empirical evidence to support that finding.
UK
We used the data in the Bridge Education report.
Interestingly a December 2015 report by Times Higher Education’s International Unit: International Undergradute Students: The UK’s competitive advantage, arrived at a lower figure, stating:
Education agents feature in the decision-making of at least 26% of international undergraduates in the UK. This figure is lower than for all the UK’s major English-speaking rivals.
USA
Again we used the data in the Bridge Education Group report.
Did you find this post helpful? Please help us by sharing:
[mashshare]